Immunocytochemistry
Introduction
Immunocytochemistry (ICC) is a technique for the visualization of proteins and peptides in cells using biomolecules capable of binding the protein of interest. Usually the biomolecule is an antibody which is linked to a reporter, e.g. a fluorophore, fluorescent dye, or enzyme. The reporter will give rise to a signal, e.g. fluorescence or color from an enzyme reaction, which is then detectable by a microscope. The type of microscope used for image acquisition depends on the type of reporter. Samples may be cultured cells or taken from a biosample containing cells. The biosample can be a tissue section, mouth swab, blood sample, or any sample taken from an individual, animal, or plant. In ICC the analysis is applied on cells with the extracellular matrix removed, compared to immunohistochemistry (IHC), where a mix of different cells within a tissue section is analyzed including its surrounding tissue.
Technology
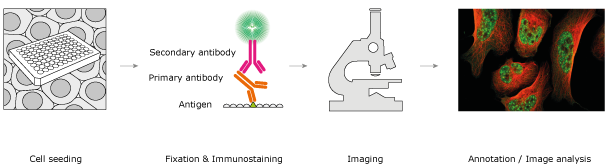
Immunocytochemistry is performed in four steps. First the cells are seeded on a solid support, e.g. into a 96 well plate with glass bottom or on a glass slide. Depending on the type of cell and seeding technique, an incubation time might be necessary before proceeding with immunostaining; e.g. in the case of seeding adherent cells, the cells will attach to the solid support surface during the incubation, which varies from half an hour to 24 h for the different cell types. In the second step, the cells are immunostained: cells are fixed, permeabilized, and stained with antibodies. Fixation retains the proteins in the cell and preserves their chemical and structural state at the time of fixation. It can be done for example by crosslinking or by precipitating the proteins. During permeabilization, lipids are removed from membranes allowing the antibodies to cross the membranes. Without this step the antibodies are restricted to the outside of the cell due to their size. The permeabilization limits the technique to studying dead cells. Following the immunostaining, washing steps are applied to remove any unbound antibodies. In the third step, the cells are visualized using a microscope and images are taken. In the final step, the images are analyzed and cellular structures are annotated. Figure 1 describes a typical workflow for ICC using fluorescence as reporter.
Figure 1. The four steps of immunocytochemistry: (i) cell seeding, (ii) immunostaining, (iii) imaging, and (iv) image analysis.
Reporters
As for IHC, there are different reporter systems available for ICC. One is the use of enzyme-coupled antibodies: after the addition of a substrate, the enzymes catalyze a visible color reaction at the place where the enzyme-coupled antibody is bound in the sample. For example, the commonly used enzyme horseradish peroxidase (HRP) can convert 3,3'-diaminobenzidine (DAB) into a brown precipitate that is deposited in the sample at the site of the reaction. The brown color stain may be seen using light-microscopy. Another reporter is fluorescence, which relies on the physical properties of a molecule to be excited to a higher energy state by absorbing light of one wavelength. Thereafter the molecule relaxes to the ground state, while emitting light of a longer wavelength. These molecules are called fluorophores, and they may be visualized using a fluorescence microscope. This type of microscope is able to excite the fluorophores, while at the same time detecting their emission. Since different fluorophores are excited by different wavelengths of light and also emit light at different wavelengths, multiple fluorophores with different colors, may be combined in the same sample. This enables the acquisition of multicolor images, where each color represents a specific type of biomolecule. The spectral overlap of the excitation and emission profiles of the fluorophores is the limiting factor when adding different types of fluorophores to a sample. Fluorophores with similar spectral properties cannot be separated and the resulting image will show an indistinguishable mix of different signals, which defeats the purpose of the immunochemistry analysis. In addition to fluorophore-labeled antibodies, there are molecules that are fluorescent by themselves and have the ability to bind specifically to other molecules. These molecules may be used together with the fluorophore-labeled antibodies. One example is 4',6-diamidino-2-phenylindole (DAPI), which binds DNA. It is excited by ultraviolet light and then emits blue light. A downside of using fluorophores as reporters is the bleaching that occurs when the fluorophores are exposed to light. Over time, the stained sample will decrease in brightness.
Table 1 Examples of different reporters
Reporter type |
Reporter example |
Visualization |
Specificity |
| Enzyme-coupled antibody |
Antibody-peroxidase + DAB |
Brown color |
Antigen |
| Fluorophore-labeled antibody |
Antibody-Cy3 |
Green excitation / yellow emission |
Antigen |
| Biospecific small molecule dye |
DAPI |
UV excitation / blue emission |
DNA |
Direct vs indirect detection
The detection method for the immunostaining can be either direct or indirect. In the direct method, one reporter labeled antibody is used; this method is quick, however, it is not sensitive enough for most proteins as the number of present copies of the protein is too low to yield a strong signal. Targeting a specific protein in a cell with a primary antibody and a reporter-coupled secondary antibody directed at the primary antibody is a much more sensitive method (see Figure 1ii). The increased sensitivity of the indirect method is due to the multiple binding of secondary antibodies to the same primary antibody, which will amplify the signal. Another advantage is also an increased flexibility because of the possibility to vary the primary and secondary antibody combination. The disadvantages of the indirect method are a higher requirement of work and time, and a risk of non-specific binding of the secondary antibody.
Specific examples
In the Human Protein Atlas (HPA), ICC with fluorescence as reporter is used to analyze the subcellular distribution of proteins to build a subcellular atlas of the whole human proteome (Barbe et al., 2008). For each protein the subcellular localization is studied in three different human cell lines, using the antibodies produced in the HPA project. The cells are cultured in vitro, fixed and permeabilized by formaldehyde and detergent treatment, and then immunofluorescently stained (Stadler et al., 2010). In addition to the HPA antibodies, two antibodies are used to stain the endoplasmic reticulum and microtubules fluorescently, and the cells are also counterstained with the nuclear probe DAPI. A confocal laser scanning microscope equipped with a 63x magnification, oil immersion objective is used to acquire images of the staining. The images are manually annotated and the subcellular localization, characteristics, and staining intensity are described. Further, a validation score is set for each antibody indicating if the results are supported by other experimental data. In the end, a knowledge-based revision of the subcellular distribution is performed in a gene-centric manner, taking into account the staining of one or multiple antibodies. Figure 2 shows typical results from ICC using fluorescence and DAB.
|
Figure 2a. RNA binding motif protein 25 (RBM25) localized in the nuclear speckles (green). Microtubules are stained in red.
|
|
|
Figure 2b. Golgin B1 (GOLGB1) localized in the Golgi apparatus (green). Microtubules are stained in red, nucleus is stained in blue.
|
|
|
Figure 2c. Electron-transfer-flavoprotein, alpha polypeptide (ETFA) localized in mitochondria (green). Microtubules are stained in red, nucleus is stained in blue.
|
|
|
Figure 2d. Trefoil factor 1 (TFF1) detected at medium/high levels in a subset of cell lines.
|
|
In addition to the subcellular studies, the HPA project is also analyzing a broad panel of cell lines and primary blood cells to provide an overview of protein expression patterns (Andersson et al., 2006). Cell microarrays consisting of 46 cell lines, ten leukemia blood cell samples and two samples of peripheral blood mononuclear cells (PBMC) are built. For the preparation of the microarrays the cells of the different cell lines are fixed in formaldehyde, dispersed in agarose, embedded in paraffin and then placed on glass slides. The analysis of the protein expression is carried out by using the HPA generated primary antibodies, HRP-coupled secondary antibodies, and DAB substrate. The outcome is a brown color precipitate, which correlates with the protein expression. The cells are also counterstained with hematoxylin to give a general staining of the cell structure.
ICC can also be used to diagnose diseases. For example, serum from severe acute respiratory syndrome (SARS) patients have been analyzed using SARS-associated coronavirus (SARS-CoV) infected monkey cells and fluorophore-labeled secondary antibodies (Chan et al., 2004). If a patient is infected with SARS-CoV, serum from the patient will contain antibodies against SARS-CoV. To test for the presence of these antibodies, SARS-CoV infected monkey cells are immunostained; patient sera is used as primary antibody mix and a fluorophore-labeled anti-human antibody is used as secondary antibody. If the sera contain SARS-CoV antibodies, these will bind the SARS-CoV in the monkey cells. Washing the fixed cells removes any non-bound sera antibodies from the cells. Adding the anti-human secondary antibody will stain the human SARS-CoV antibodies. The stained cells are inspected with a fluorescence microscope. Since the anti-human secondary antibody in the monkey cells cannot bind any native monkey proteins, only cells incubated with sera containing human SARS-CoV antibodies will give a positive signal.
References and Links
- Andersson, A.-C., Strömberg, S., Bäckvall, H., Kampf, C., Uhlen, M., Wester, K., & Pontén, F. (2006). Analysis of protein expression in cell microarrays: a tool for antibody-based proteomics. The Journal of Histochemistry and Cytochemistry: Official Journal of the Histochemistry Society, 54(12), 141323.
DOI:10.1074/mcp.M113.034140. PubMed: 16957166
- Barbe, L., Lundberg, E., Oksvold, P., Stenius, A., Lewin, E., Björling, E., ... Andersson-Svahn, H. (2008). Toward a confocal subcellular atlas of the human proteome. Molecular & Cellular Proteomics: MCP, 7(3), 499508.
DOI:10.1074/mcp.M700325-MCP200. PubMed: 18029348
- Chan, P. K. S., Ng, K.-C., Chan, R. C. W., Lam, R. K. Y., Chow, V. C. Y., Hui, M., ... Tam, J. S. (2004). Immunofluorescence assay for serologic diagnosis of SARS. Emerging Infectious Diseases, 10(3), 5302.
DOI:10.3201/eid1003.030493. PubMed: 15109430
- Stadler, C., Skogs, M., Brismar, H., Uhlén, M., & Lundberg, E. (2010). A single fixation protocol for proteome-wide immunofluorescence localization studies. Journal of Proteomics, 73(6), 106778.
DOI:10.1016/j.jprot.2009.10.012. PubMed: 19896565
- Applications of Immunocytochemistry - An open-access book about ICC:
Ana L. De Paul, J. H. M. J. P. P. S. G. A. A. Q. C. A. M. and A. I. T. Applications of Immunocytochemistry; Dehghani, H., Ed.; InTech, 2012.
http://www.intechopen.com/books/applications-of-immunocytochemistry
- Immunocytochemistry, a technique for the visualization of proteins and peptides in cells:
http://en.wikipedia.org/wiki/Immunocytochemistry
- Immunostaining, the use of an antibody-based method to detect a specific target in a sample:
http://en.wikipedia.org/wiki/Immunostaining
- Immunofluorescence, one type of immunostaining that uses a fluorophore coupled to an antibody for detection:
http://en.wikipedia.org/wiki/Immunofluorescence
- IHC world Protocols, Forum, Products, and more:
http://www.ihcworld.com/immunocytochemistry.htm
- Current Protocols - a continuously updating reference for researchers:
http://www.currentprotocols.com/WileyCDA/
- The Protocol Exchange - an Open Repository for the deposition and sharing of protocols for scientific research:
http://www.nature.com/protocolexchange/protocols
- Antibodypedia - An open-access database of publicly available antibodies and their usefulness in various applications:
http://www.antibodypedia.com
|
|
|
|
|
|