|
|
ANTIBODY AND ANTIGEN INFORMATION
? »
|
The antibody and antigen information page lists the antigens and corresponding antibodies that have been used in the Human Protein Atlas project, together with the validation results for the antibodies.
In-house generated antibodies have the prefix "HPA". Antibodies provided by external distributors have the prefix "CAB". Links to providers for the antibodies are listed under antibody information, as well as the product name of the antibody as given by the provider.
The host species and the clonality (pAb = polyclonal, mAb = monoclonal, msAb = monospecific) of the antibody as well as the purification method is reported. The Human Protein Atlas version in which the antibody was first released is given.
The antigen type, length (amino acid residues) and sequence is reported (if available) under antigen information. The percent identity (if >=80%) of the antigen sequence to the different proteins encoded by this gene and a link to the corresponding protein on the Ensembl website is listed. Any matches with >=80% sequence identity to proteins from other Ensembl human genes are reported as "Other gene match" together with a link to that gene in the Human Protein Atlas and the maximum sequence identity (%) of the antigen to the matched protein(s) encoded by that gene.
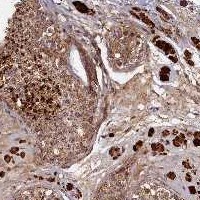
The antibody validation section reports the results from different assays. For immunohistochemistry, the image shown is a selected tissue with representative staining for this antibody. This image is clickable for enlarged view. Images from all tissues analysed using this antibody are found under the Normal tissue and Cancer tissue headings in the menu to the left. There is also a short summary describing the observed staining patterns using this antibody for immunohistochemistry in a panel of human tissues (see annotation). The validation scoring of the antibody is described here.
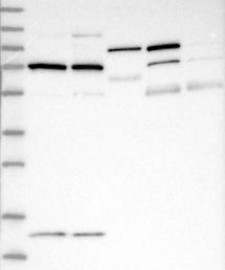
For Western blot, the images for supportive and uncertain validations are shown ( validation description), and the different lanes are described ( WB description). The image is clickable for enlarged view. The expected target mass for the targeted proteins is also listed.
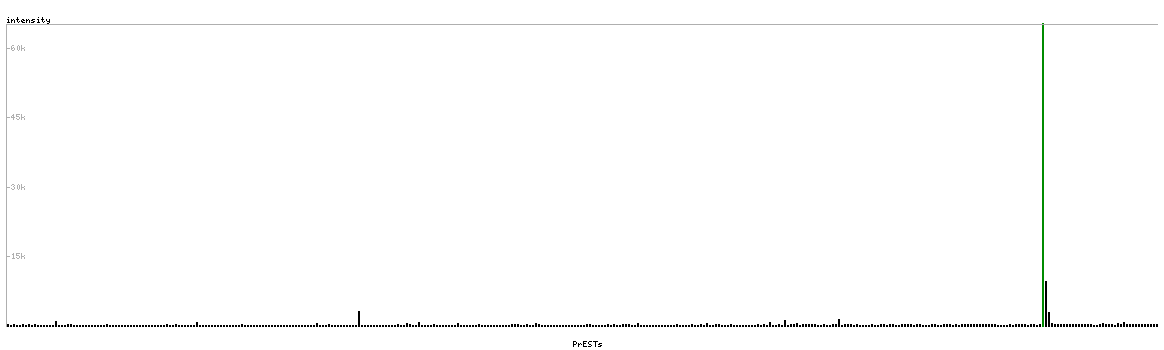
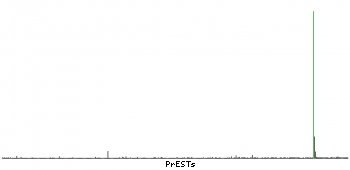
For in-house generated (HPA) antibodies, a protein array assay is performed. The image is a diagram showing the specificity analysis using a number of different Protein Epitope Signature Tags (PrESTs), including the target PrEST (marked in green). The validation is described here.
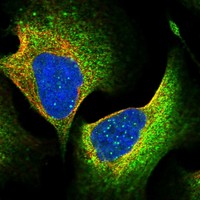
For the subcellular analysis using immunoflourescence, a representative image from the validation is shown, together with a summary of the staining. The validation is described here.
|
| |
|
|
Antibody HPA034966
|
|
Antibody CAB001946
|
|
Antibody CAB018369
|
|
|
ANTIBODY INFORMATION
|
|
Provider |
Atlas Antibodies
Sigma-Aldrich
| | Upstate
| | Santa Cruz Biotechnology
| |
Product name |
HPA034966 | | 05-842 | | sc-646 | |
Host species |
Rabbit | | Rabbit | | Rabbit | |
Clonality |
pAb | | pAb | | msAb | |
Purity |
Affinity purified using the PrEST-antigen as affinity ligand | | Not known | | Affinity | |
Released in version |
8 | | 4 | | 9 | |
|
ANTIGEN INFORMATION
|
|
Antigen |
Recombinant protein fragment | | Not known | | Synthetic peptide | |
Length (aa) |
80 | | | | | |
Antigen sequence |
RVHSKSVESNIEDKIFGKTYRKKASLPNLSHVTENLIIGAFVTEPQIIQE
RPLTNKLKRKRRPTSGLHPEDFIKKADLAV
| |
| |
| |
Matching transcripts |
BRCA1-001 - ENSP00000350283 [100%]
BRCA1-004 - ENSP00000419988 [100%]
BRCA1-005 - ENSP00000418960 [100%]
BRCA1-006 - ENSP00000418775 [100%]
BRCA1-011 - ENSP00000419274 [100%]
BRCA1-026 - ENSP00000397145 [100%]
BRCA1-201 - ENSP00000310938 [100%]
BRCA1-202 - ENSP00000246907 [100%]
BRCA1-205 - ENSP00000326002 [100%]
| | | | | |
Other gene match |
| | | | | |
|
ANTIBODY VALIDATION
|
|
|
Immunohistochemistry
|
|
Image |
 | |  | |  | |
Description |
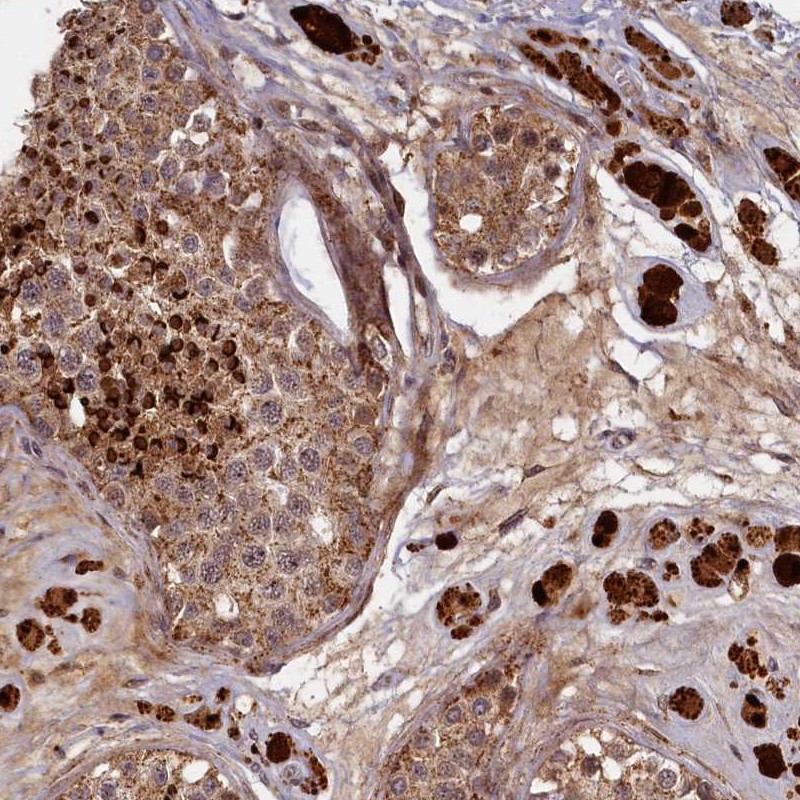
Immunohistochemical staining of human breast shows moderate cytoplasmic and nuclear positivity in glandular cells.
More information | | Immunohistochemical staining of human cerebellum shows strong cytoplasmic positivity in purkinje cells.
More information | | Immunohistochemical staining of human testis shows strong cytoplasmic positivity in cells in seminiferus ducts and Leydig cells.
More information | |
Retrieval method |
HIER pH6 | | HIER pH6 | | HIER pH6 | |
Antibody dilution |
1:150 | | 1:750 | | 1:125 | |
Literature conformity |
Consistent with extensive gene/protein characterization data | | Consistent with extensive gene/protein characterization data | | Partly consistent with extensive gene/protein characterization data | |
RNA consistency |
Not done | | Not done | | Not done | |
|
Western Blot
|
|
Image |
 | |  | |  | |
Description |
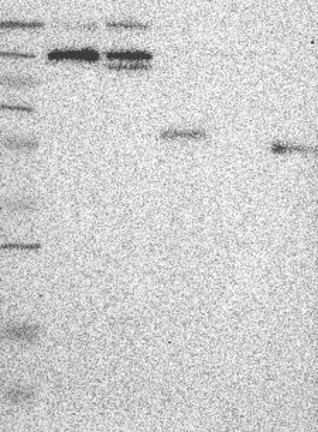
Lane 1: Marker [kDa] 230, 130, 95, 72, 56, 36, 28, 17, 11
Lane 2: RT4
Lane 3: U-251 MG
Lane 4: Human Plasma
Lane 5: Liver
Lane 6: Tonsil
More information | | Lane 1: Marker [kDa] 250, 130, 95, 72, 55, 36, 28, 17, 11
Lane 2: RT4
Lane 3: U-251 MG
Lane 4: Human Plasma
Lane 5: Liver
Lane 6: Tonsil
More information | | Lane 1: Marker [kDa] 250, 130, 100, 70, 55, 35, 25, 15, 10
Lane 2: RT4
Lane 3: U-251 MG
Lane 4: Human Plasma
Lane 5: Liver
Lane 6: Tonsil
More information | |
Target mass (kDa) |
210.3, 207.7, 202.3, 181.4, 178.3, 174.4, 73.1, 70, 49 | | 210.3, 207.7, 202.3, 181.4, 178.3, 174.4, 85, 80.6, 78.2, 76.2, 73.1, 70, 69.5, 63.6, 55.5, 53.4, 49, 39.8, 35.9, 29.5, 26.3, 25.1, 20, 19.8, 11.2, 10.9, 7.2, 6.7 | | 210.3, 207.7, 202.3, 181.4, 178.3, 174.4, 85, 80.6, 78.2, 76.2, 73.1, 70, 69.5, 63.6, 55.5, 53.4, 49, 39.8, 35.9, 29.5, 26.3, 25.1, 20, 19.8, 11.2, 10.9, 7.2, 6.7 | |
Antibody dilution |
1:250 | | 1:500 | | 1:500 | |
Validation WB |
Supportive: Band of predicted size in kDa (+/-20%) with additional bands present | | Supportive: Band of predicted size in kDa (+/-20%) with additional bands present | | Supportive: Band of predicted size in kDa (+/-20%) with additional bands present | |
|
Immunofluorescence
|
|
Image |
 | | | | | |
Description |
Immunofluorescent staining of human cell line U-2 OS shows positivity in plasma membrane & cytoplasm.
More information | | Application not done for this antibody. | | Application not done for this antibody. | |
Antibody dilution |
1:200 | | | | | |
Validation IF |
Supportive: The subcellular location is supported by literature. | | | | | |
|
Protein array
|
|
Image |
 | | | | | |
Description |
Antibody specificity analysis with protein arrays. Predicted and matching interactions are shown in green.
More information | | Application not done for this antibody. | | Application not done for this antibody. | |
Antibody dilution |
1:3000 | | | | | |
Validation PA |
Supportive: Pass with single peak corresponding to interaction only with its own antigen. | | | | | |
| |
|
|
ANTIGEN VIEW
? »
|
The antigen view displays the antigen location on the target protein(s) and the features of the target protein. The tabs at the top of the protein view section can be used to switch between the different splice variants to which an antigen has been mapped.
At the top of the protein view, the position of the antigen (identified by the corresponding HPA identifier) is shown as a green bar. A yellow triangle on the bar indicates a <100% sequence identity to the protein target.
Under the antigens, the maximum percent sequence identity of the protein to all other proteins from other human genes is displayed, using a sliding window of 10 aa residues (HsID 10) or 50 aa residues (HsID 50) ( read more).
If a signal peptide is predicted by a majority of the signal peptide predictors SPOCTOPUS, SignalP 4.0 and Phobius (turquoise) and/or transmembrane regions (orange) are predicted by MDM, these are displayed.
Low complexity regions are shown in yellow and InterPro regions in green.
Common (purple) and unique (grey) regions between alternative processed transcripts from the same gene are also displayed ( read more), and at the bottom of the protein view is the protein scale.
|
|
|
|
|
|
|
|