|
Antibody HPA001238
|
|
Antibody HPA063909
|
|
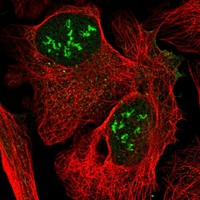
Antibody CAB000348
|
|
Antibody CAB068199
|
|
Antibody CAB068200
|
|
Antibody CAB068201
|
|
|
ANTIBODY INFORMATION
|
|
Provider |
Atlas Antibodies
Sigma-Aldrich
| | Atlas Antibodies
Sigma-Aldrich
| | Lab Vision/NeoMarkers
| | Atlas Antibodies
Sigma-Aldrich
| | Atlas Antibodies
Sigma-Aldrich
| | Atlas Antibodies
Sigma-Aldrich
| |
Product name |
HPA001238 | | HPA063909 | | RB-1539 | | AMAb90804 | | AMAb90805 | | AMAb90806 | |
Host species |
Rabbit | | Rabbit | | Rabbit | | Mouse | | Mouse | | Mouse | |
Clonality |
pAb | | pAb | | pAb | | mAb | | mAb | | mAb | |
Purity |
Affinity purified using the PrEST-antigen as affinity ligand | | Affinity purified using the PrEST-antigen as affinity ligand | | Not known | | Protein A/G | | Protein A/G | | Protein A/G | |
Released in version |
2 | | 13 | | 1 | | 13 | | 13 | | 13 | |
|
ANTIGEN INFORMATION
|
|
Antigen |
Recombinant protein fragment | | Recombinant protein fragment | | Not known | | Recombinant protein | | Recombinant protein | | Recombinant protein | |
Length (aa) |
146 | | 74 | | | | | | | | | |
Antigen sequence |
PRQRQSTLVLFPGDLRTNLTDRQLAEEYLYRYGYTRVAEMRGESKSLGPA
LLLLQKQLSLPETGELDSATLKAMRTPRCGVPDLGRFQTFEGDLKWHHHN
ITYWIQNYSEDLPRAVIDDAFARAFALWSAVTPLTFTRVYSRDADI
| | WRFDVKAQMVDPRSASEVDRMFPGVPLDTHDVFQYREKAYFCQDRFYWRV
SSRSELNQVDQVGYVTYDILQCPE
| |
| |
| |
| |
| |
Matching transcripts |
MMP9-001 - ENSP00000361405 [100%]
| | MMP9-001 - ENSP00000361405 [100%]
| | | | | | | | | |
Other gene match |
| | | | | | | | | | | |
|
ANTIBODY VALIDATION
|
|
|
Immunohistochemistry
|
|
Image |
 | |  | |  | |  | |  | |  | |
Description |
Immunohistochemical staining of human bone marrow shows strong cytoplasmic positivity in bone marrow poietic cells.
More information | | Immunohistochemical staining of human bone marrow shows strong cytoplasmic positivity in subset of hematopoietic cells.
More information | | Immunohistochemical staining of human bone marrow shows strong nuclear and cytoplasmic positivity in bone marrow poietic cells.
More information | | Immunohistochemical staining of human spleen shows strong cytoplasmic positivity in cells in red pulp.
More information | | Immunohistochemical staining of human bone marrow shows strong cytoplasmic positivity in subset of hematopoietic cells.
More information | | Immunohistochemical staining of human spleen shows strong cytoplasmic positivity in subset of cells in white pulp and red pulp.
More information | |
Retrieval method |
HIER pH6 | | HIER pH6 | | HIER pH6 | | HIER pH6 | | HIER pH6 | | HIER pH6 | |
Antibody dilution |
1:700 | | 1:2500 | | 1:1000 | | 1:2000 | | 1:2000 | | 1:1000 | |
Literature conformity |
Consistent with extensive gene/protein characterization data | | Consistent with extensive gene/protein characterization data | | Consistent with extensive gene/protein characterization data | | Consistent with extensive gene/protein characterization data | | Consistent with extensive gene/protein characterization data | | Consistent with extensive gene/protein characterization data | |
RNA consistency |
Consistent with RNAseq data | | Consistent with RNAseq data | | Mainly not consistent with RNAseq data | | Consistent with RNAseq data | | Consistent with RNAseq data | | Consistent with RNAseq data | |
|
Immunofluorescence
|
|
Image |
 | | | |  | | | | | | | |
Description |
Immunofluorescent staining of human cell line U-2 OS shows positivity in cytoplasm.
More information | | Application not done for this antibody. | | Immunofluorescent staining of human cell line U-2 OS shows positivity in nucleoli.
More information | | Application not done for this antibody. | | Application not done for this antibody. | | Application not done for this antibody. | |
Antibody dilution |
1:43 | | | | 1:200 | | | | | | | |
Validation IF |
Uncertain: The subcellular location is partly supported by literature or no literature is available. | | | | Uncertain: The subcellular location is partly supported by literature or no literature is available. | | | | | | | |
|
Western Blot
|
|
Image |
 | |  | | | |  | |  | |  | |
Description |
Lane 1: Marker [kDa] 250, 130, 95, 72, 55, 36, 28, 17, 10
Lane 2: Negative control (vector only transfected HEK293T lysate)
Lane 3: Over-expression Lysate (Co-expressed with a C-terminal myc-DDK tag (~3.1 kDa) in mammalian HEK293T cells, LY401553)
More information | | Lane 1: Marker [kDa] 250, 130, 95, 72, 55, 36, 28, 17, 10
Lane 2: Negative control (vector only transfected HEK293T lysate)
Lane 3: Over-expression Lysate (Co-expressed with a C-terminal myc-DDK tag (~3.1 kDa) in mammalian HEK293T cells, LY401553)
More information | | | | Lane 1: Marker [kDa] 250, 130, 100, 70, 55, 35, 25, 15, 10
Lane 2: RT4
Lane 3: U-251 MG
Lane 4: Human Plasma
Lane 5: Liver
Lane 6: Tonsil
More information | | Lane 1: Marker [kDa] 250, 130, 100, 70, 55, 35, 25, 15, 10
Lane 2: RT4
Lane 3: U-251 MG
Lane 4: Human Plasma
Lane 5: Liver
Lane 6: Tonsil
More information | | Lane 1: Marker [kDa] 250, 130, 100, 70, 55, 35, 25, 15, 10
Lane 2: RT4
Lane 3: U-251 MG
Lane 4: Human Plasma
Lane 5: Liver
Lane 6: Tonsil
More information | |
Target mass (kDa) |
78.5 | | 78.5 | | 78.5 | | 78.5 | | 78.5 | | 78.5 | |
Antibody dilution |
1:250 | | 1:250 | | 1:5000 | | 1:1000 | | 1:1000 | | 1:1000 | |
Validation WB |
Supportive: Single band corresponding to the predicted size in kDa (+/-20%) | | Supportive: Single band corresponding to the predicted size in kDa (+/-20%) | | Non-supportive: Only bands not corresponding to the predicted size | | Uncertain: Single band differing more than +/-20% from predicted size in kDa and not supported by experimental and/or bioinformatic data | | Uncertain: Single band differing more than +/-20% from predicted size in kDa and not supported by experimental and/or bioinformatic data | | Uncertain: Single band differing more than +/-20% from predicted size in kDa and not supported by experimental and/or bioinformatic data | |
|
Protein array
|
|
Image |
 | |  | | | | | | | | | |
Description |
Antibody specificity analysis with protein arrays. Predicted and matching interactions are shown in green.
More information | | Antibody specificity analysis with protein arrays. Predicted and matching interactions are shown in green.
More information | | Application not done for this antibody. | | Application not done for this antibody. | | Application not done for this antibody. | | Application not done for this antibody. | |
Antibody dilution |
1:3000 | | 1:4350 | | | | | | | | | |
Validation PA |
Supportive: Pass with single peak corresponding to interaction only with its own antigen. | | Supportive: Pass with single peak corresponding to interaction only with its own antigen. | | | | | | | | | |
| |