|
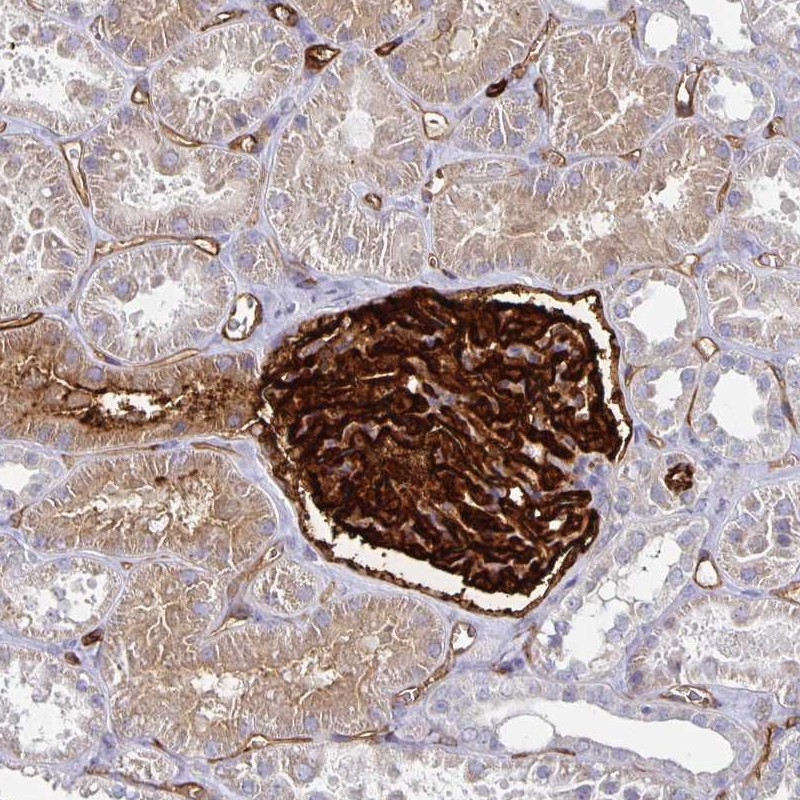
Antibody HPA002110
|
|
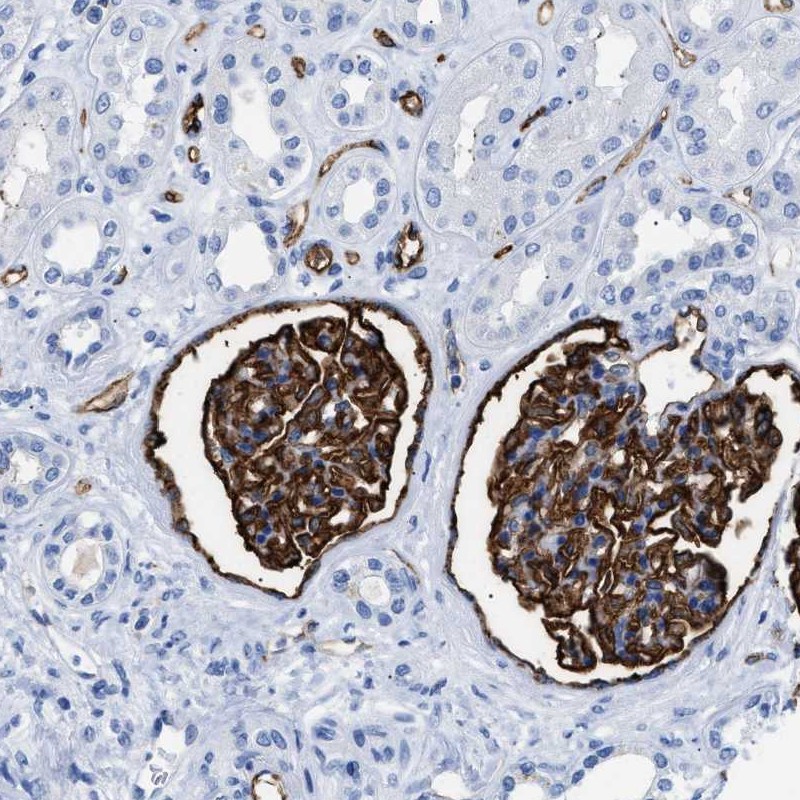
Antibody HPA045507
|
|
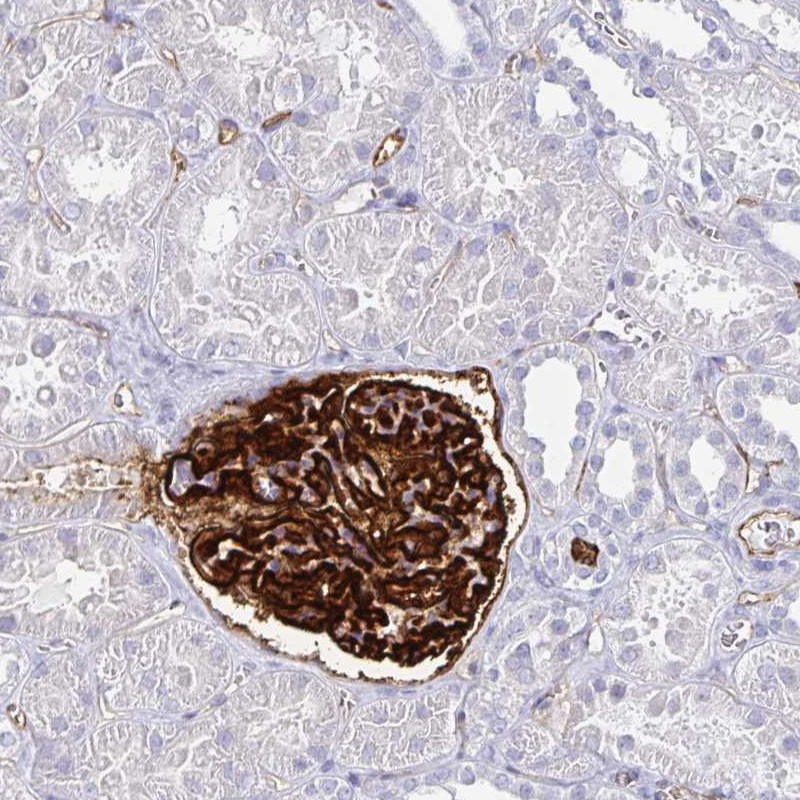
Antibody CAB016169
|
|
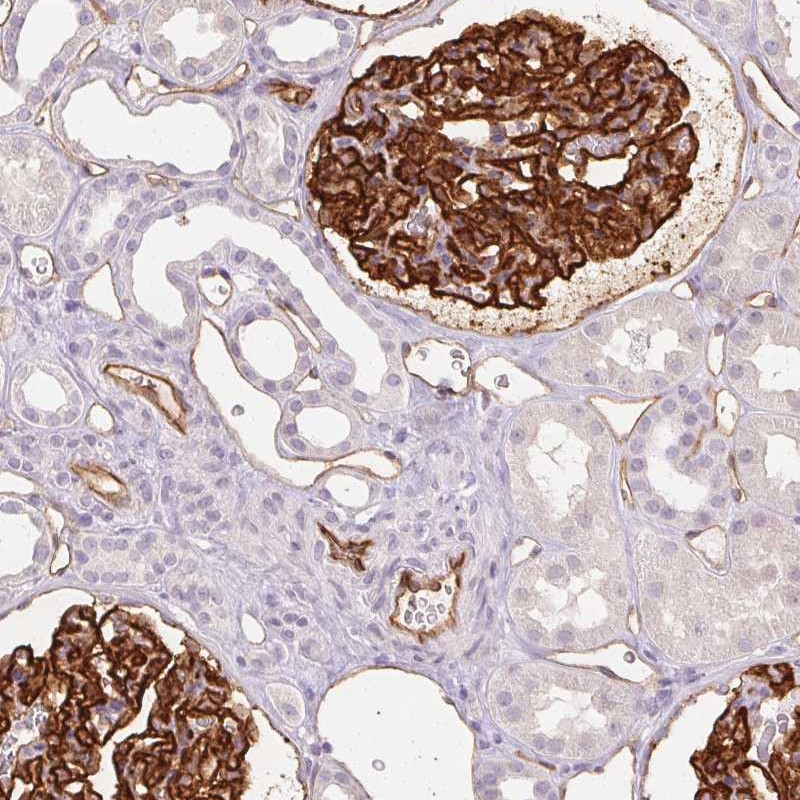
Antibody CAB062558
|
|
Antibody CAB068219
|
|
Antibody CAB068220
|
|
|
ANTIBODY INFORMATION
|
|
Provider |
Atlas Antibodies
Sigma-Aldrich
| | Atlas Antibodies
Sigma-Aldrich
| | Santa Cruz Biotechnology
| | Atlas Antibodies
Sigma-Aldrich
| | Atlas Antibodies
Sigma-Aldrich
| | Atlas Antibodies
Sigma-Aldrich
| |
Product name |
HPA002110 | | HPA045507 | | sc-23903 | | AMAb90667 | | AMAb90643 | | AMAb90644 | |
Host species |
Rabbit | | Rabbit | | Mouse | | Mouse | | Mouse | | Mouse | |
Clonality |
pAb | | pAb | | mAb | | mAb | | mAb | | mAb | |
Purity |
Affinity purified using the PrEST-antigen as affinity ligand | | Affinity purified using the PrEST-antigen as affinity ligand | | Protein A/G | | Protein A/G | | Protein A/G | | Protein A/G | |
Released in version |
4 | | 10 | | 4 | | 12 | | 13 | | 13 | |
|
ANTIGEN INFORMATION
|
|
Antigen |
Recombinant protein fragment | | Recombinant protein fragment | | Not known | | Recombinant protein | | Recombinant protein | | Recombinant protein | |
Length (aa) |
138 | | 142 | | | | | | | | | |
Antigen sequence |
LPETMSSSPTAASTTHRYPKTPSPTVAHESNWAKCEDLETQTQSEKQLVL
NLTGNTLCAGGASDEKLISLICRAVKATFNPAQDKCGIRLASVPGSQTVV
VKEITIHTKLPAKDVYERLKDKWDELKEAGVSDMKLGD
| | QNATQTTTDSSNKTAPTPASSVTIMATDTAQQSTVPTSKANEILASVKAT
TLGVSSDSPGTTTLAQQVSGPVNTTVARGGGSGNPTTTIESPKSTKSADT
TTVATSTATAKPNTTSSQNGAEDTTNSGGKSSHSVTTDLTST
| |
| |
| |
| |
| |
Matching transcripts |
PODXL-001 - ENSP00000319782 [100%]
PODXL-005 - ENSP00000367817 [100%]
PODXL-202 - ENSP00000440518 [100%]
PODXL-201 - ENSP00000442655 [87%]
| | PODXL-001 - ENSP00000319782 [100%]
PODXL-003 - ENSP00000390152 [100%]
PODXL-005 - ENSP00000367817 [100%]
PODXL-201 - ENSP00000442655 [100%]
PODXL-202 - ENSP00000440518 [99%]
| | | | | | | | | |
Other gene match |
| | | | | | | | | | | |
|
ANTIBODY VALIDATION
|
|
|
Immunohistochemistry
|
|
Image |
 | |  | |  | |  | |  | |  | |
Description |
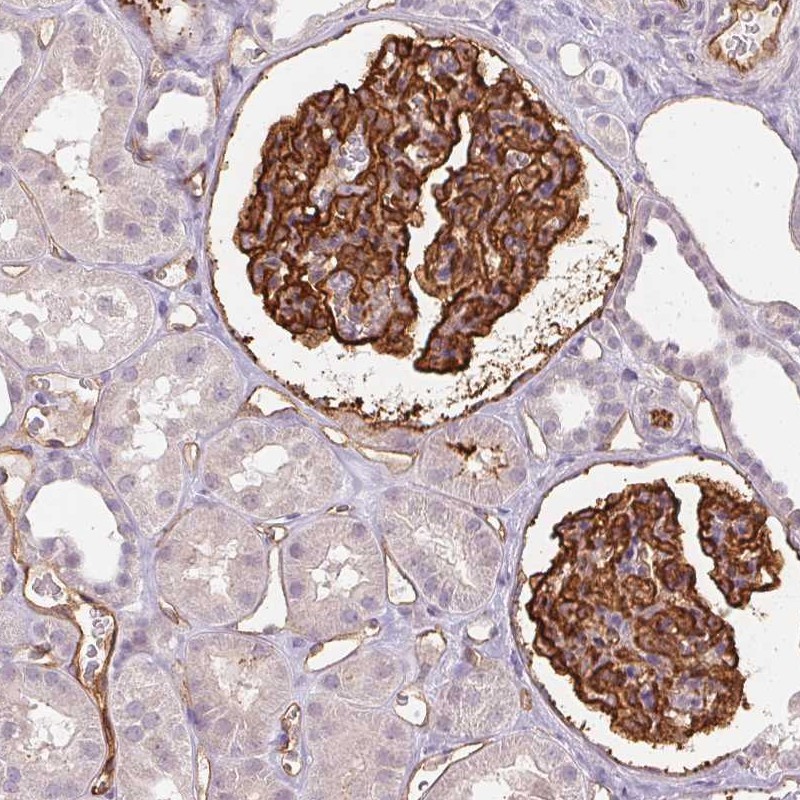
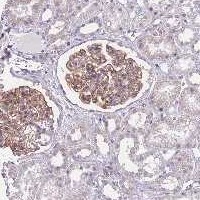
Immunohistochemical staining of human kidney shows strong cytoplasmic positivity in cells in glomeruli.
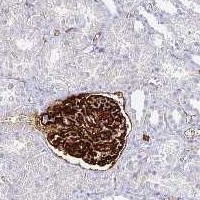
More information | | Immunohistochemical staining of human kidney shows moderate membranous positivity in renal glomeruli.
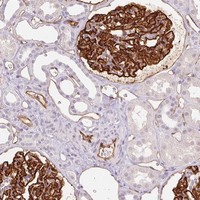
More information | | Immunohistochemical staining of human kidney shows cytoplasmic positivity in glomeruli.
More information | | Immunohistochemical staining of human kidney shows strong cytoplasmic and membranous positivity in cells in glomeruli.
More information | | Immunohistochemical staining of human kidney shows strong cytoplasmic and membranous positivity in cells in glomeruli.
More information | | Immunohistochemical staining of human kidney shows strong membranous positivity in cells in glomeruli.
More information | |
Retrieval method |
HIER pH6 | | HIER pH6 | | HIER pH6 | | HIER pH6 | | HIER pH6 | | HIER pH6 | |
Antibody dilution |
1:250 | | 1:125 | | 1:300 | | 1:250 | | 1:2000 | | 1:5000 | |
Literature conformity |
Consistent with extensive gene/protein characterization data | | Partly consistent with extensive gene/protein characterization data | | Consistent with extensive gene/protein characterization data | | Consistent with extensive gene/protein characterization data | | Consistent with extensive gene/protein characterization data | | Consistent with extensive gene/protein characterization data | |
RNA consistency |
Not done | | Not done | | Not done | | Consistent with RNAseq data | | Mainly consistent with RNAseq data | | Mainly consistent with RNAseq data | |
|
Immunofluorescence
|
|
Image |
 | |  | |  | | | | | | | |
Description |
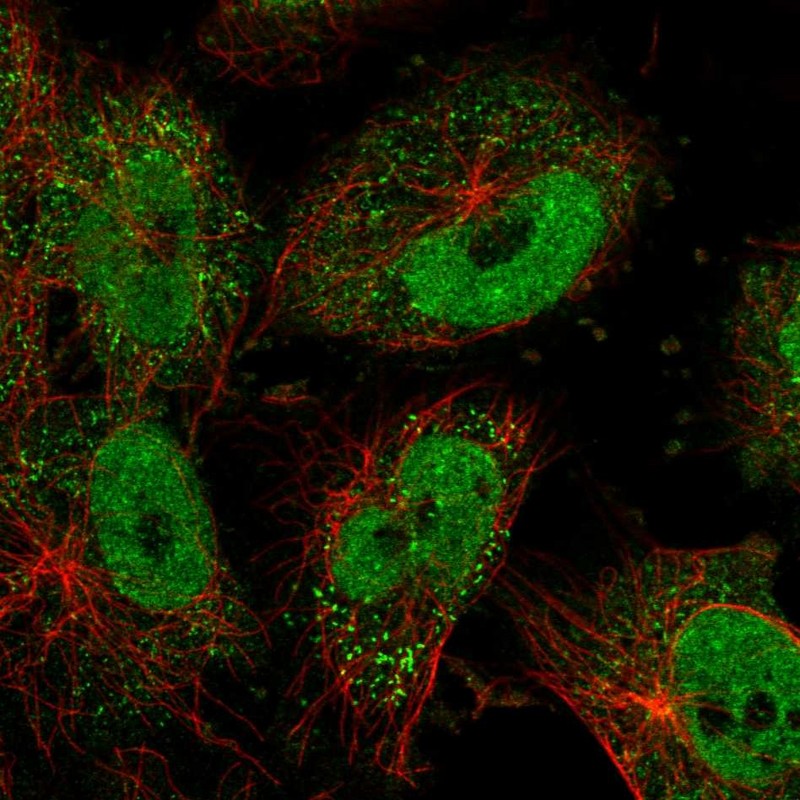
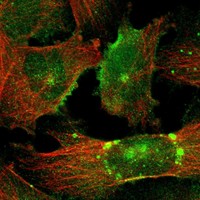
Immunofluorescent staining of human cell line U-251 MG shows positivity in nucleoli, plasma membrane, vesicles & microtubule organizing center.
More information | | Immunofluorescent staining of human cell line U-251 MG shows positivity in vesicles & nucleus but excluded from the nucleoli.
More information | | Immunofluorescent staining of human cell line U-251 MG shows positivity in vesicles.
More information | | Application not done for this antibody. | | Application not done for this antibody. | | Application not done for this antibody. | |
Antibody dilution |
1:87 | | 1:7 | | 1:75 | | | | | | | |
Validation IF |
Uncertain: The subcellular location is partly supported by literature or no literature is available. | | Non-supportive: The subcellular location is not consistent with literature. | | Non-supportive: The subcellular location is not consistent with literature. | | | | | | | |
|
Western Blot
|
|
Image |
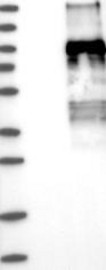 | |  | |  | | | |  | |  | |
Description |
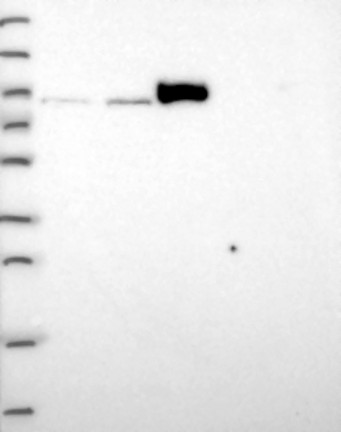
Lane 1: Marker [kDa] 250, 130, 95, 72, 55, 36, 28, 17, 10
Lane 2: Negative control (vector only transfected HEK293T lysate)
Lane 3: Over-expression Lysate (Co-expressed with a C-terminal myc-DDK tag (~3.1 kDa) in mammalian HEK293T cells, LY401657)
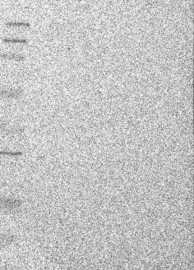
More information | | Lane 1: Marker [kDa] 250, 130, 95, 72, 55, 36, 28, 17, 10
Lane 2: RT4
Lane 3: U-251 MG
Lane 4: Human Plasma
Lane 5: Liver
Lane 6: Tonsil
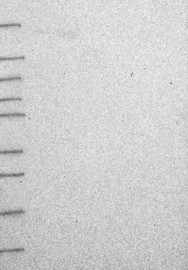
More information | | Lane 1: Marker [kDa] 250, 130, 95, 72, 55, 36, 28, 17, 11
Lane 2: RT4
Lane 3: U-251 MG
Lane 4: Human Plasma
Lane 5: Liver
Lane 6: Tonsil
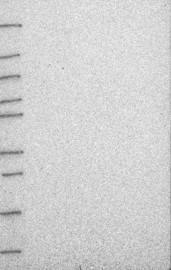
More information | | | | Lane 1: Marker [kDa] 250, 130, 100, 70, 55, 35, 25, 15, 10
Lane 2: RT4
Lane 3: U-251 MG
Lane 4: Human Plasma
Lane 5: Liver
Lane 6: Tonsil
More information | | Lane 1: Marker [kDa] 250, 130, 100, 70, 55, 35, 25, 15, 10
Lane 2: RT4
Lane 3: U-251 MG
Lane 4: Human Plasma
Lane 5: Liver
Lane 6: Tonsil
More information | |
Target mass (kDa) |
58.9, 58.6, 55.4, 55.3 | | 58.9, 58.6, 55.4, 55.3, 32.7 | | 58.9, 58.6, 55.4, 55.3, 32.7 | | 58.9, 58.6, 55.4, 55.3, 32.7 | | 58.9, 58.6, 55.4, 55.3, 32.7 | | 58.9, 58.6, 55.4, 55.3, 32.7 | |
Antibody dilution |
1:250 | | 1:250 | | 1:500 | | 1:500 | | 1:1000 | | 1:1000 | |
Validation WB |
Supportive: Band of predicted size in kDa (+/-20%) with additional bands present | | Uncertain: Single band larger than predicted size in kDa (+20%) but partly supported by experimental and/or bioinformatic data | | Uncertain: No bands detected | | Non-supportive: Weak band of predicted size but with additional bands of higher intensity also present | | Uncertain: No bands detected | | Uncertain: No bands detected | |
|
Protein array
|
|
Image |
 | |  | | | | | | | | | |
Description |
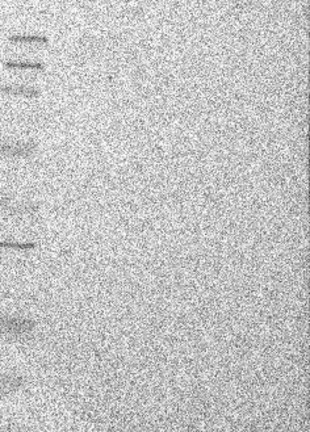
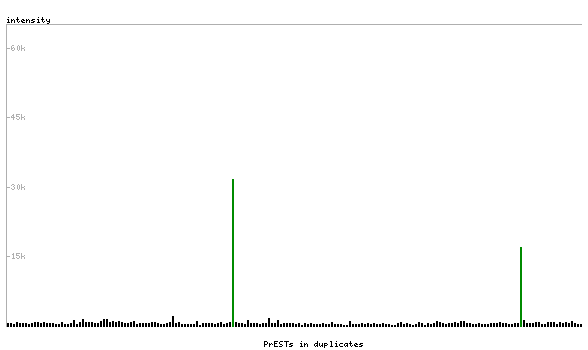
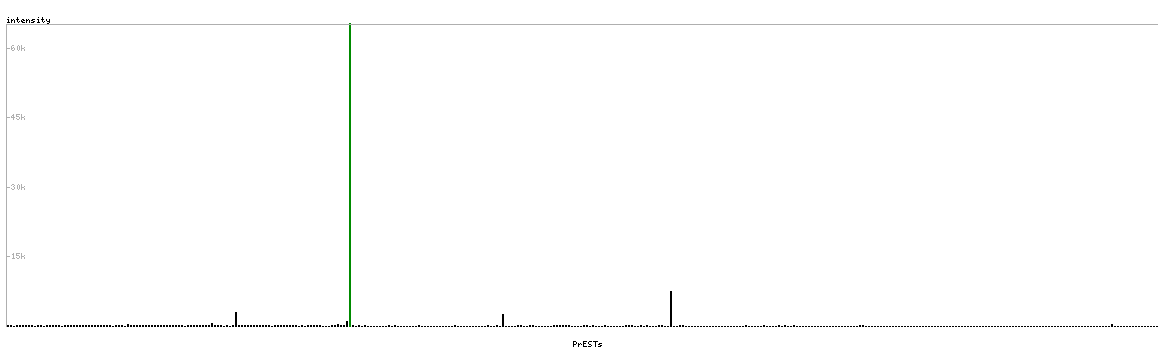
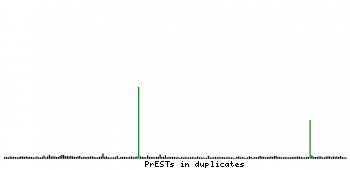
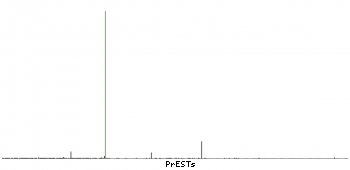
Antibody specificity analysis with protein arrays. Predicted and matching interactions are shown in green.
More information | | Antibody specificity analysis with protein arrays. Predicted and matching interactions are shown in green.
More information | | Application not done for this antibody. | | Application not done for this antibody. | | Application not done for this antibody. | | Application not done for this antibody. | |
Antibody dilution |
1:3000 | | 1:500 | | | | | | | | | |
Validation PA |
Supportive: Pass with single peak corresponding to interaction only with its own antigen. | | Supportive: Pass with single peak corresponding to interaction only with its own antigen. | | | | | | | | | |
| |