|
|
LUNG - IHC
|
Pending normal tissue analysis |
|
|
|
|
|
LUNG - RNAseq
? »
|
The RNAseq details section shows detailed information about the individual samples used for the transcript profiling and results of the RNAseq analysis.
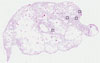
On top the transcript layout for all protein-coding transcripts of the gene, with introns scaled down by a factor 20, is shown. Untranslated regions (UTRs) are colored gray. Information about each individual sample is listed below, including gender, age, a tissue section image and estimated fractions of cell types. FPKM (Fragments Per Kilobase of exon per Million fragments mapped) values give a quantification of the gene abundance which is comparable between different genes and samples.
The plots show the mapped read coverage along all exons and introns of the gene, thereby revealing which exons are expressed and at what relative levels. The levels are normalized by total library size and scaled to fit the highest peak of all samples to the height of the plot. Thus these plots should not be used to compare abundances between different samples or genes, but rather as an indication of which transcripts are expressed and as a quality control.
|
|
|
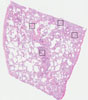
Female, age 71
|
Sample 1
FPKM: 0.6
Cell types% Pneumocytes: 40Bronchial epithelium: 5Endothelial cells: 25Macrophages: 10Other cell types: 20
|
|
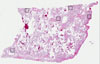
Male, age 57
|
Sample 2
FPKM: 0.1
Cell types% Pneumocytes: 35Bronchial epithelium: 5Endothelial cells: 30Macrophages: 10Other cell types: 20
|
|
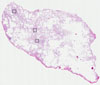
Female, age 71
|
Sample 3
FPKM: 0.9
Cell types% Pneumocytes: 35Bronchial epithelium: 10Endothelial cells: 25Macrophages: 10Other cell types: 20
|
|
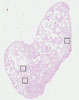
Female, age 74
|
Sample 4
FPKM: 0.0
Cell types% Pneumocytes: 40Bronchial epithelium: 0Endothelial cells: 30Macrophages: 15Other cell types: 15
|
|
Female, age 73
|
Sample 5
FPKM: 0.2
Cell types% Pneumocytes: 30Bronchial epithelium: 5Endothelial cells: 30Macrophages: 10Other cell types: 25
|
|
|
|
|
|
|